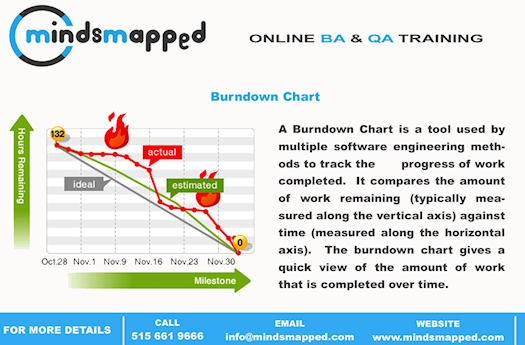
Burndown Chart |
|
|
| A Burndown Chart is a tool used by multiple software engineering methods to track the progress of work completed. It compares the amount of work remaining (typically measured along the vertical axis) against time (measured along the horizontal axis). The burndown chart gives a quick view of the amount of work that is completed over time.
MindsMapped offers online IT training services for aspiring Business Analyst's, Quality Analyst's and .NET professionals.
Our training's will prepare you to attend job interviews confidently and pass certification's exams.
We provide placement assistance and ensure you land in your dream job.
Contact Details:
Call us on 515 661 9666
E-Mail: [email protected]
www.mindsmapped.com |
|
|
|
|
     
|
|
|
 |
This Image Has Been PowerShared™ Successfully! |
|
|
|
| Check out MindsMapped Consulting's Profile, Videos, Images, and Blogs! |
|